Calculators
Welcome. This page is currently under construction.
This page provides calculators for the following purposes.:
Links are provided below and on the menu to the left./p>
Iron Calculator Instructions
This section describes two techniques for measuring liver iron non-invasively using MRI. The first method caclulates tissue T2* using a multiple TE gradient echo image. The second method uses data published by Gandon et al, in Lancet. 2004 Jan 31;363(9406):357-62. The Iron Quant protocol contains the sequences used to obtain the MR data. Each iron study should use both methods.T2*
There are two breath hold T2* sequences. Both are a single 13 second breath hold to be obtained throug the liver. Choose a slice that images most of the right lobe. One sequence has 12 echoes. The other has 8 in phase echoes. The advantages of the 8 echo sequence is that it compensates for patients with hepatic steatosis. The disadvantage of this sequence is that it has a higher minimum TE and will give less useful data points in patients with moderate to high levels of iron in their liver. In general, run and post process both sequences. The 8 echo sequence will be useful in patients with steatosis and mildly elevated iron levels.
Each sequence results in a single series of images with differing TE values. The iron concentration is determined by calculating the T2* value of the liver and calculating iron concentrations using an equation published by Wood et al. in Blood 2005; 106: 1460-1465.
T2* decay is characterized by the equation SI = exp(-TE / T2*). To calculate T2* use the calculator to the left to plot signal intensities versus TE. The calculator will fit the data points, tell you the T2*, and compute the liver iron concentration. Report the T2* value, the liver iron concentration, and reference the article by Wood et al. in Blood 2005; 106: 1460-1465.
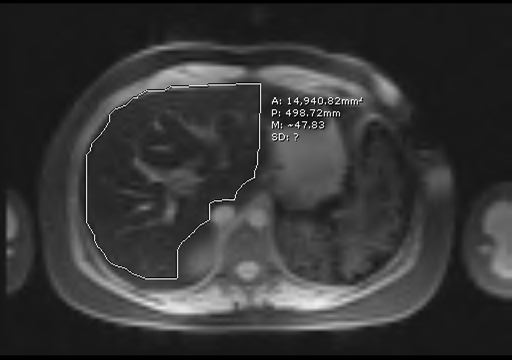
To perform the analysis, draw an ROI around the liver, excludng as much portal vein and IVC as you can. Enter the TE and mean signal intensity in to the calculator linked to on the left. When you hit submit data the graphs will appear. The calculator does not error check your input so please make sure to enter all TEs and SIs in order. Letters, skipped data points, or data points out of order will cause the program to crash. You can re-enter the the data at any time.

ROI drawn around the liver
Actually, the calculator will generate two curves to fit the MR data. The MR data is plotted in blue. The exponential fit is plotted in Green. This curve is most accurate at low concentrations of iron. The red curve is fit to an expnential plus a constant. This is becasue the signal intensities never decay to zero. Even when there is a lot of iron they always level off at somewhere between 3-6. If the curve trends towards zero then use the fit provided by the red curve as it will be more accurate.

The red graph better approximates the data when it saturates at low values.
Notice the difference in computed T2* in this case
Gandon
This method is based on a project where images with different weighting were obtained. Calculations were made and correlates with liver biopsy specimens as described in the above referenced article.
The five sequences named T1, PD, T2, T2+, and T2 ++ are located in the Iron Quant protocol. Each sequence is a 15 second single breath hold. Each should be run at the same level through the right heaptic lobe. Four slices are obtained to help correct for differences in breath hold. Onlt 1 slice needs to be analyzed. The technique is excellently described at the following web page. The calculation page is located here.
The liver iron concentration is reported in micro moles iron / g. To convert to mg / g multiply the given result by 55.845 and divide by 1000.